Time series and blocky contours

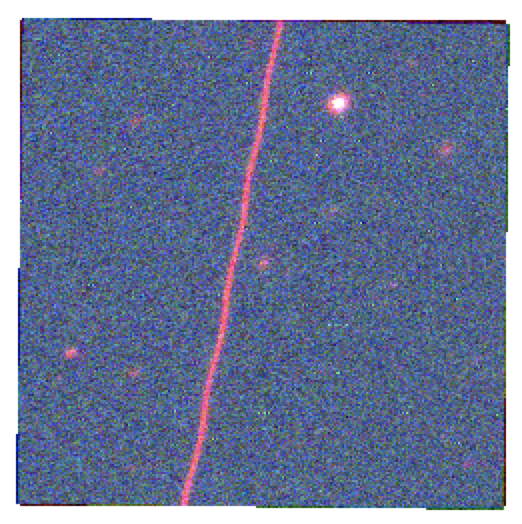
Rather than combining different bands to create an image, I tried using a sequence of images all in the same band, of the same sky area taken at different times. 

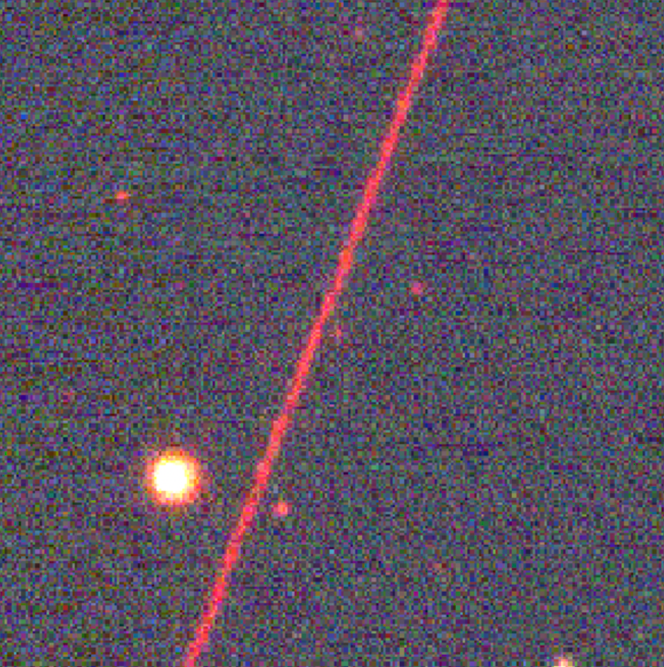
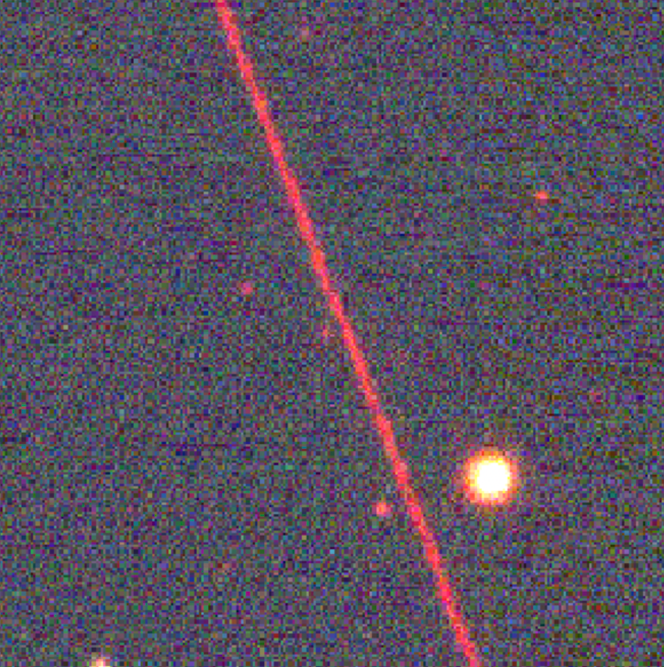
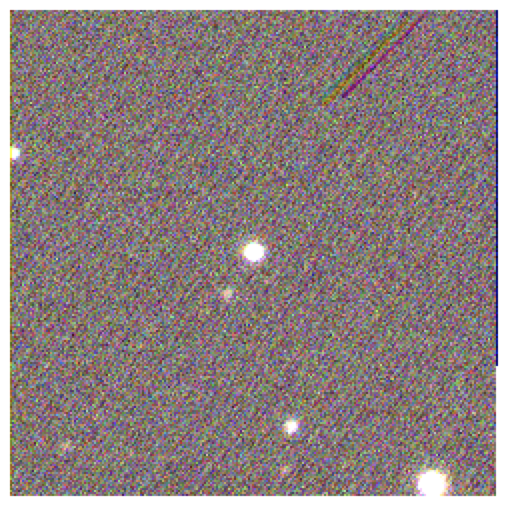
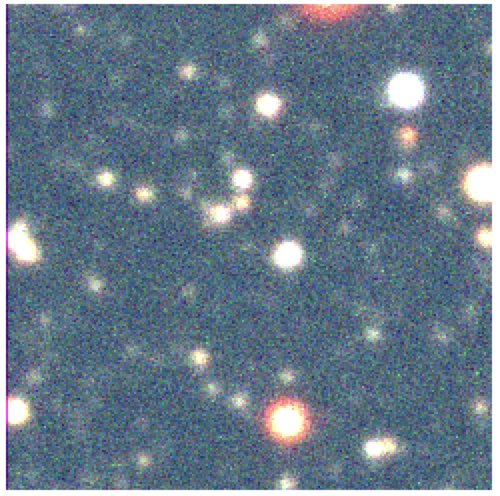
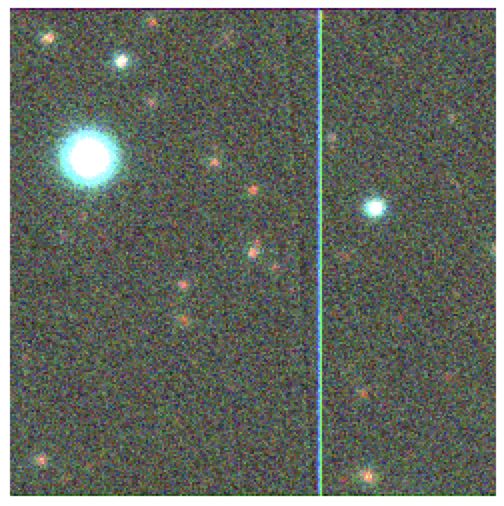
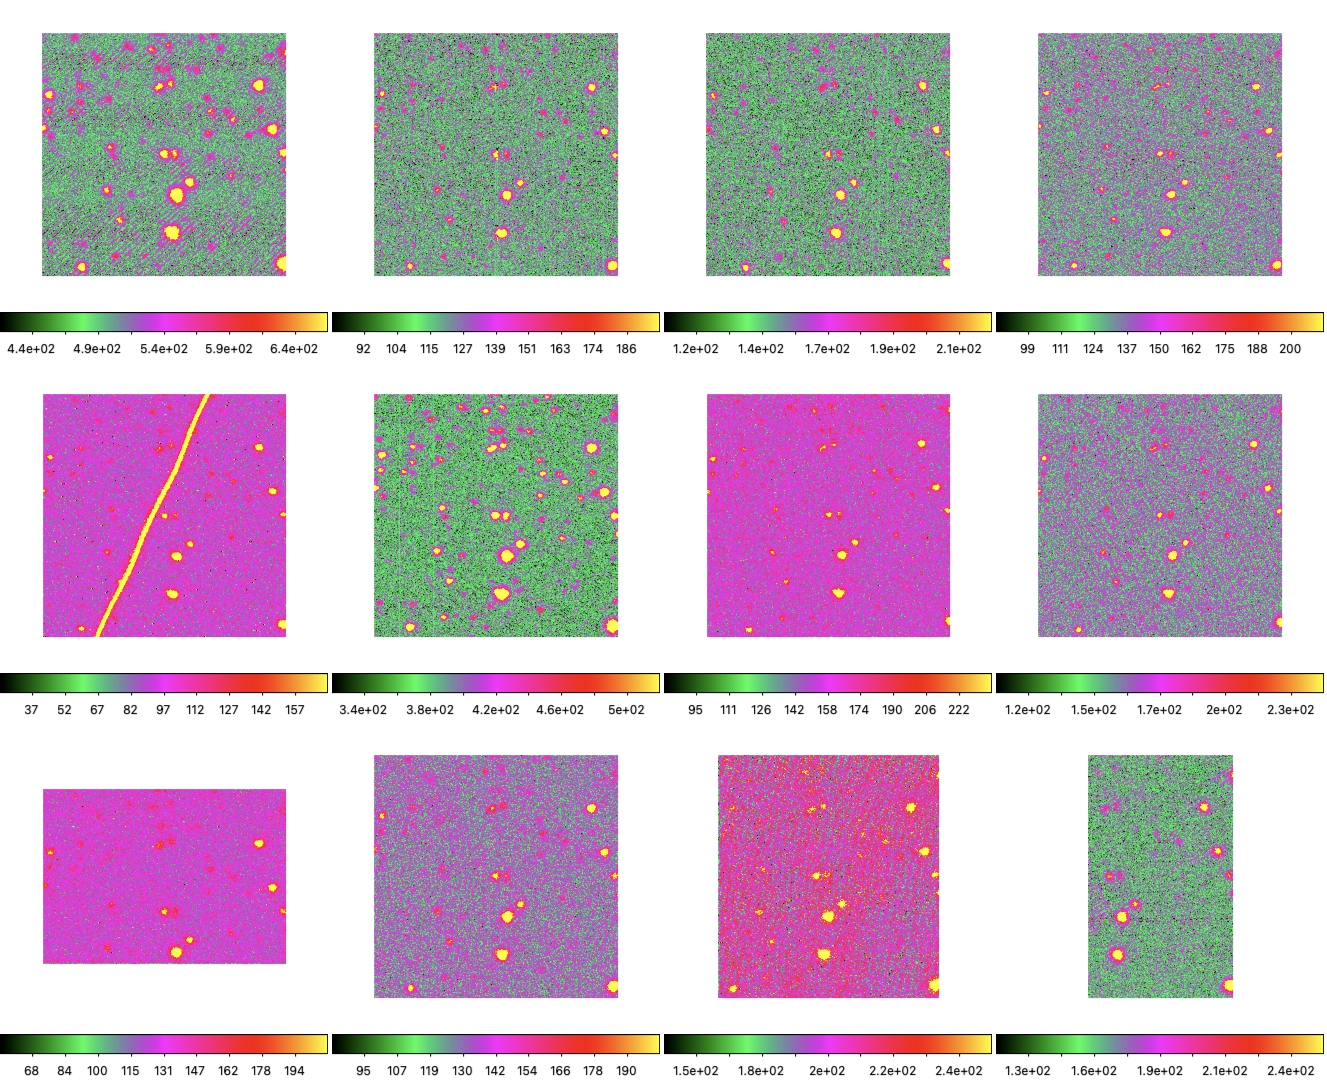
This data comes from the Skymapper Object ID 230719364, all in the z-band, taken from 2014 – 2019. One of these images is contaminated with a satellite streak but the rest of the sky stays the same. I began with this series in grayscale, compositing them into one frame that DS9 can then ‘blink’ to show that sky area through time.

A blinking sequence of greyscale star images
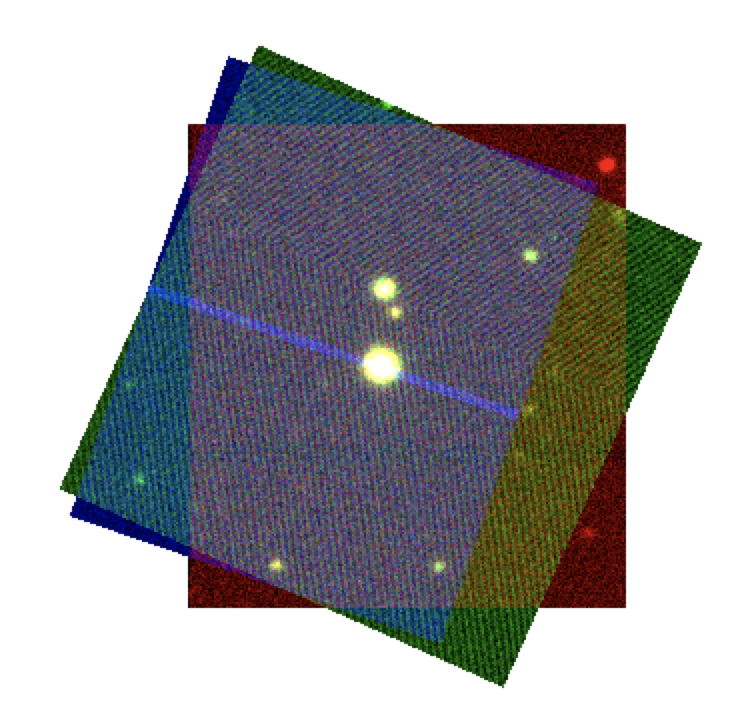
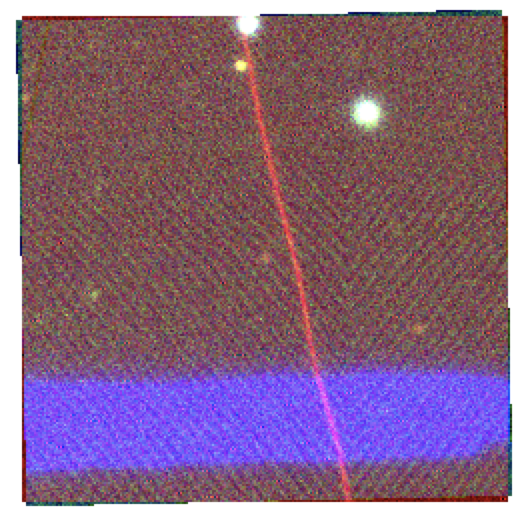
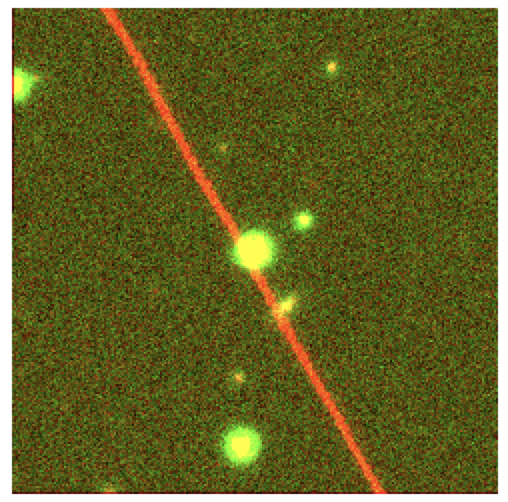
I then applied one of the preset colour options and exported them as images that I worked with as 3D video layers.

A series of star images in pink and green colours

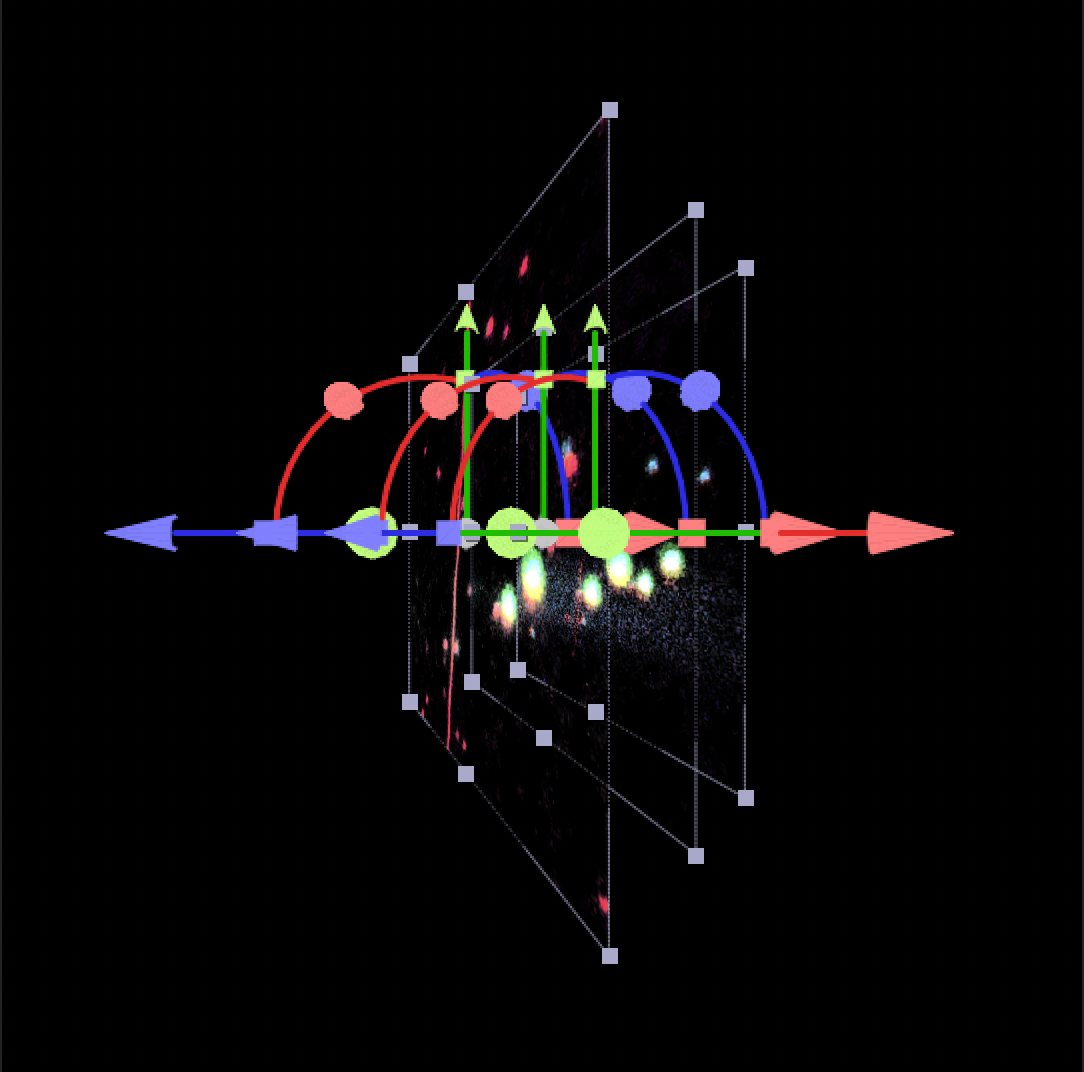
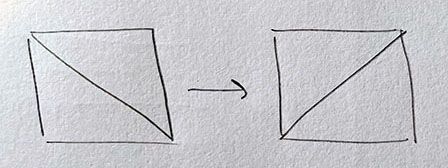
As 3D video layers, I spaced the images out from earliest to most recent.

Images lined up in 3D space Images lined up in 3D space

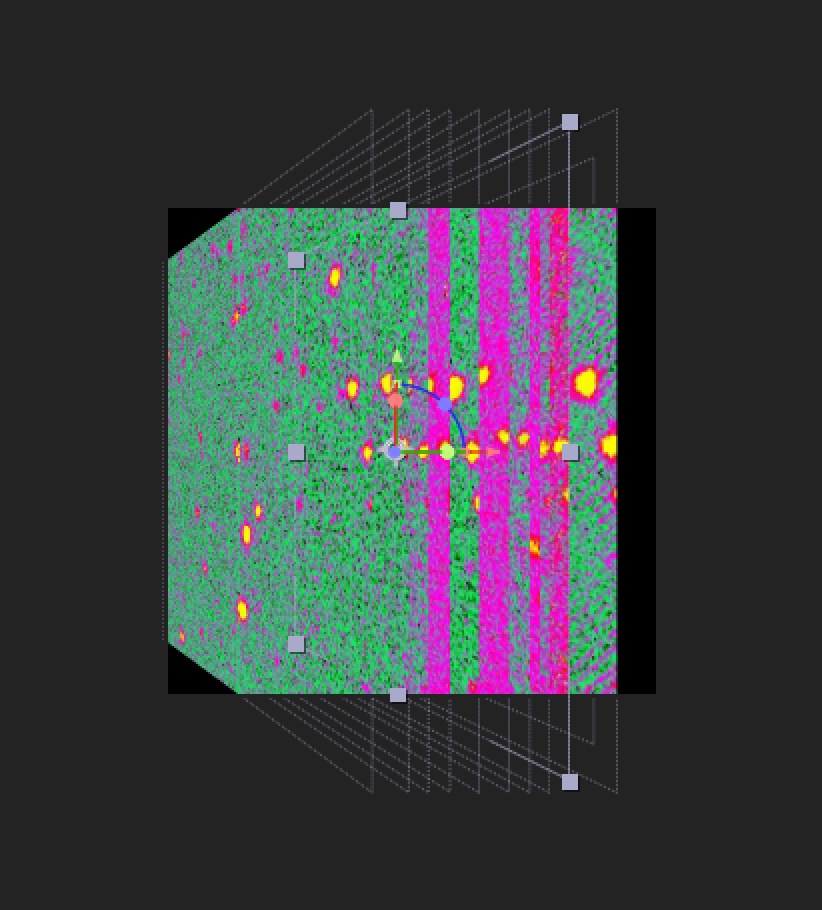
Dropping the opacity accentuates the parts of this sky section does stay the same – eg. the stars, because their repetition creates a sort of tunnel through the multiple layers. The satellite streak is then one slice of noise within that consistency. To exaggerate this and how the images interact with each other, I experimented with different blending modes.

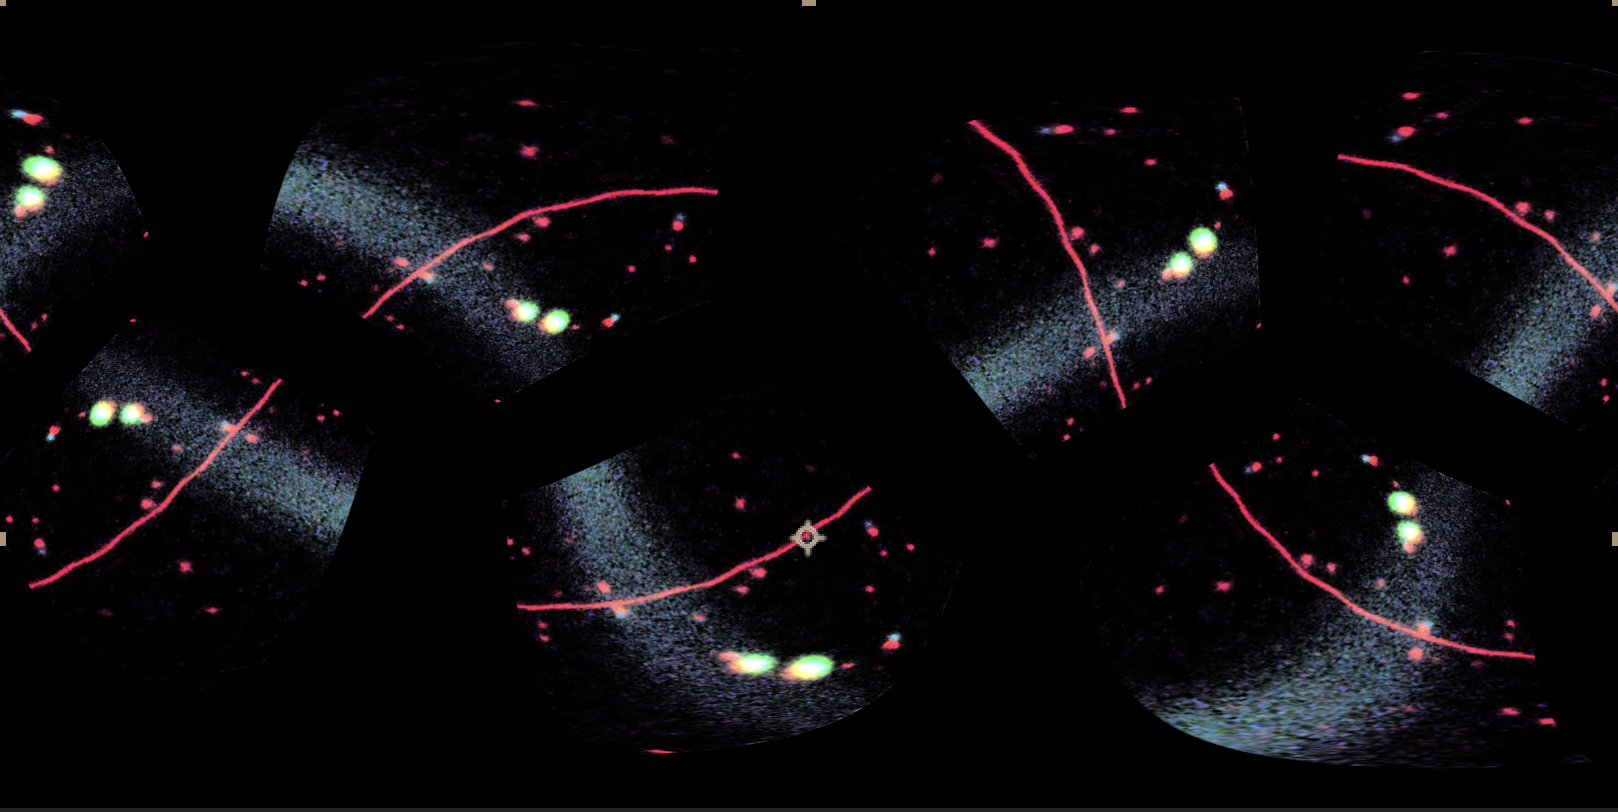
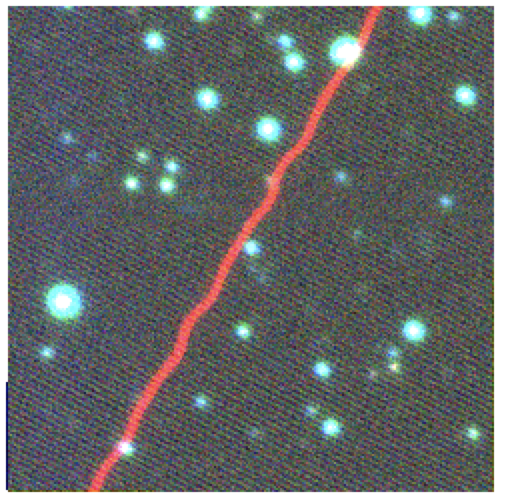
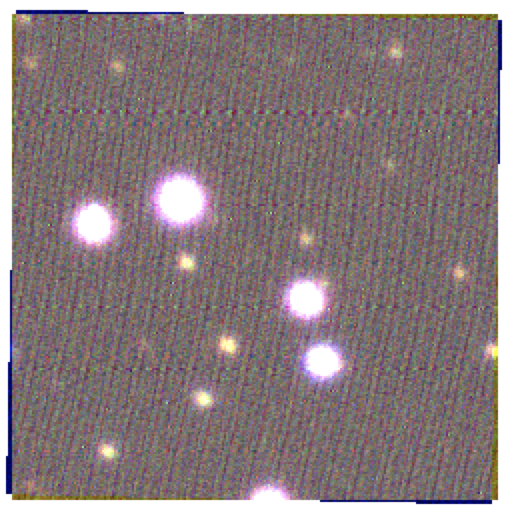
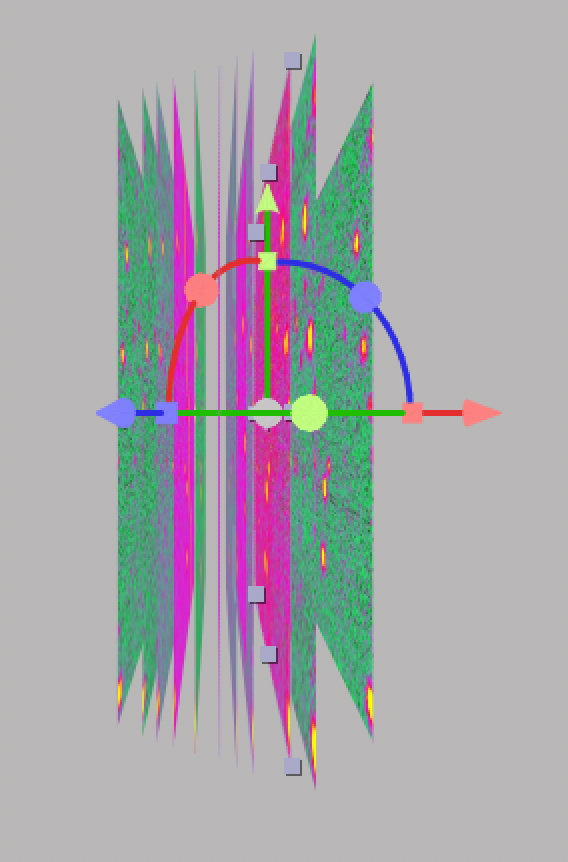
The Overlay blending mode ‘Multiplies or screens the input colour channel values, depending on whether or not the underlying colour is lighter than 50% gray. The result preserves highlights and shadows in the underlying layer.’ Using this mode the satellite streak stands out more as it is one of the lightest parts of this series of images:

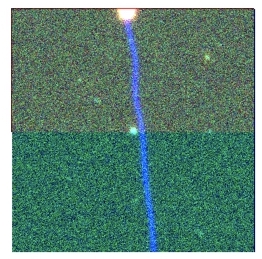
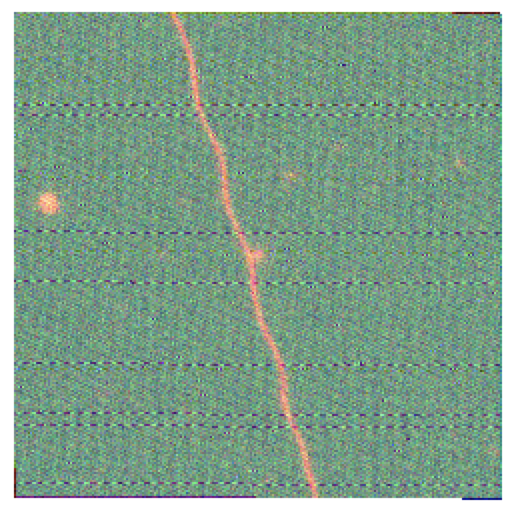
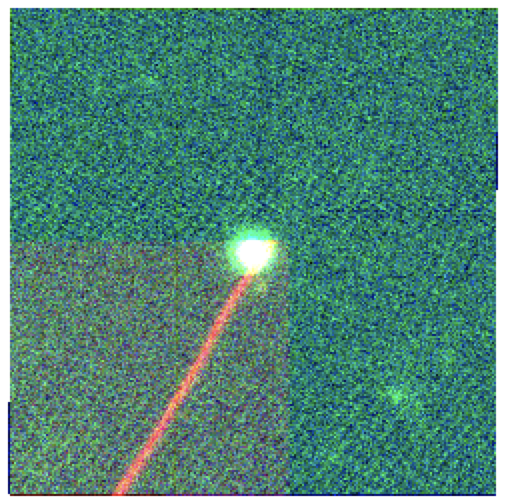
The Multiply blending mode multiplies source colour channels, darkening the accumulation of image data when more layers are combined, so the satellite streak is less visible.

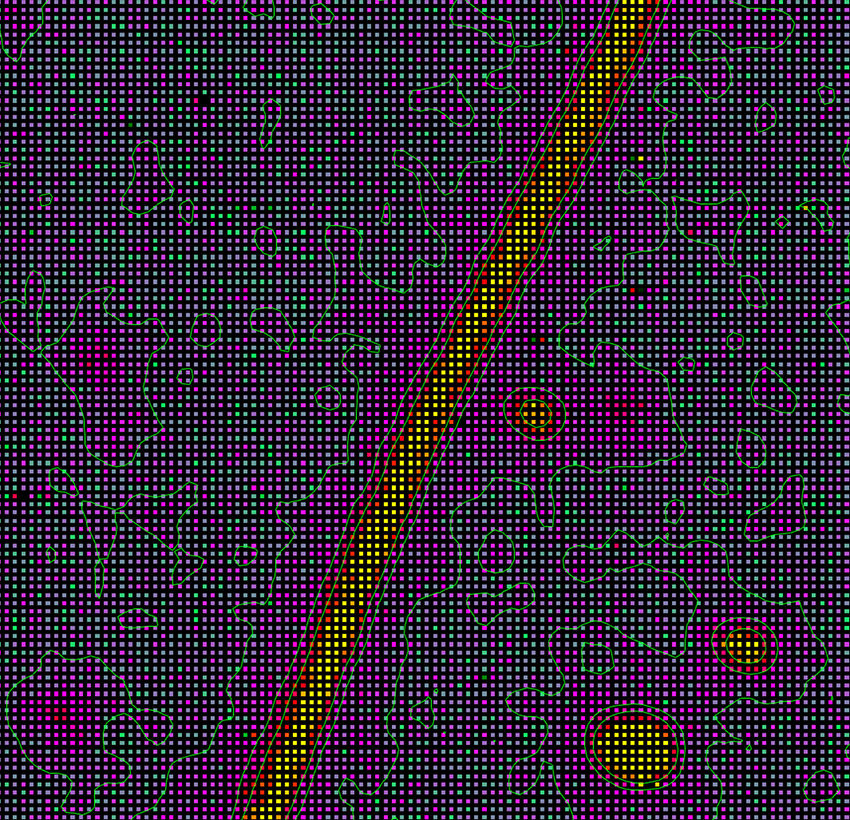
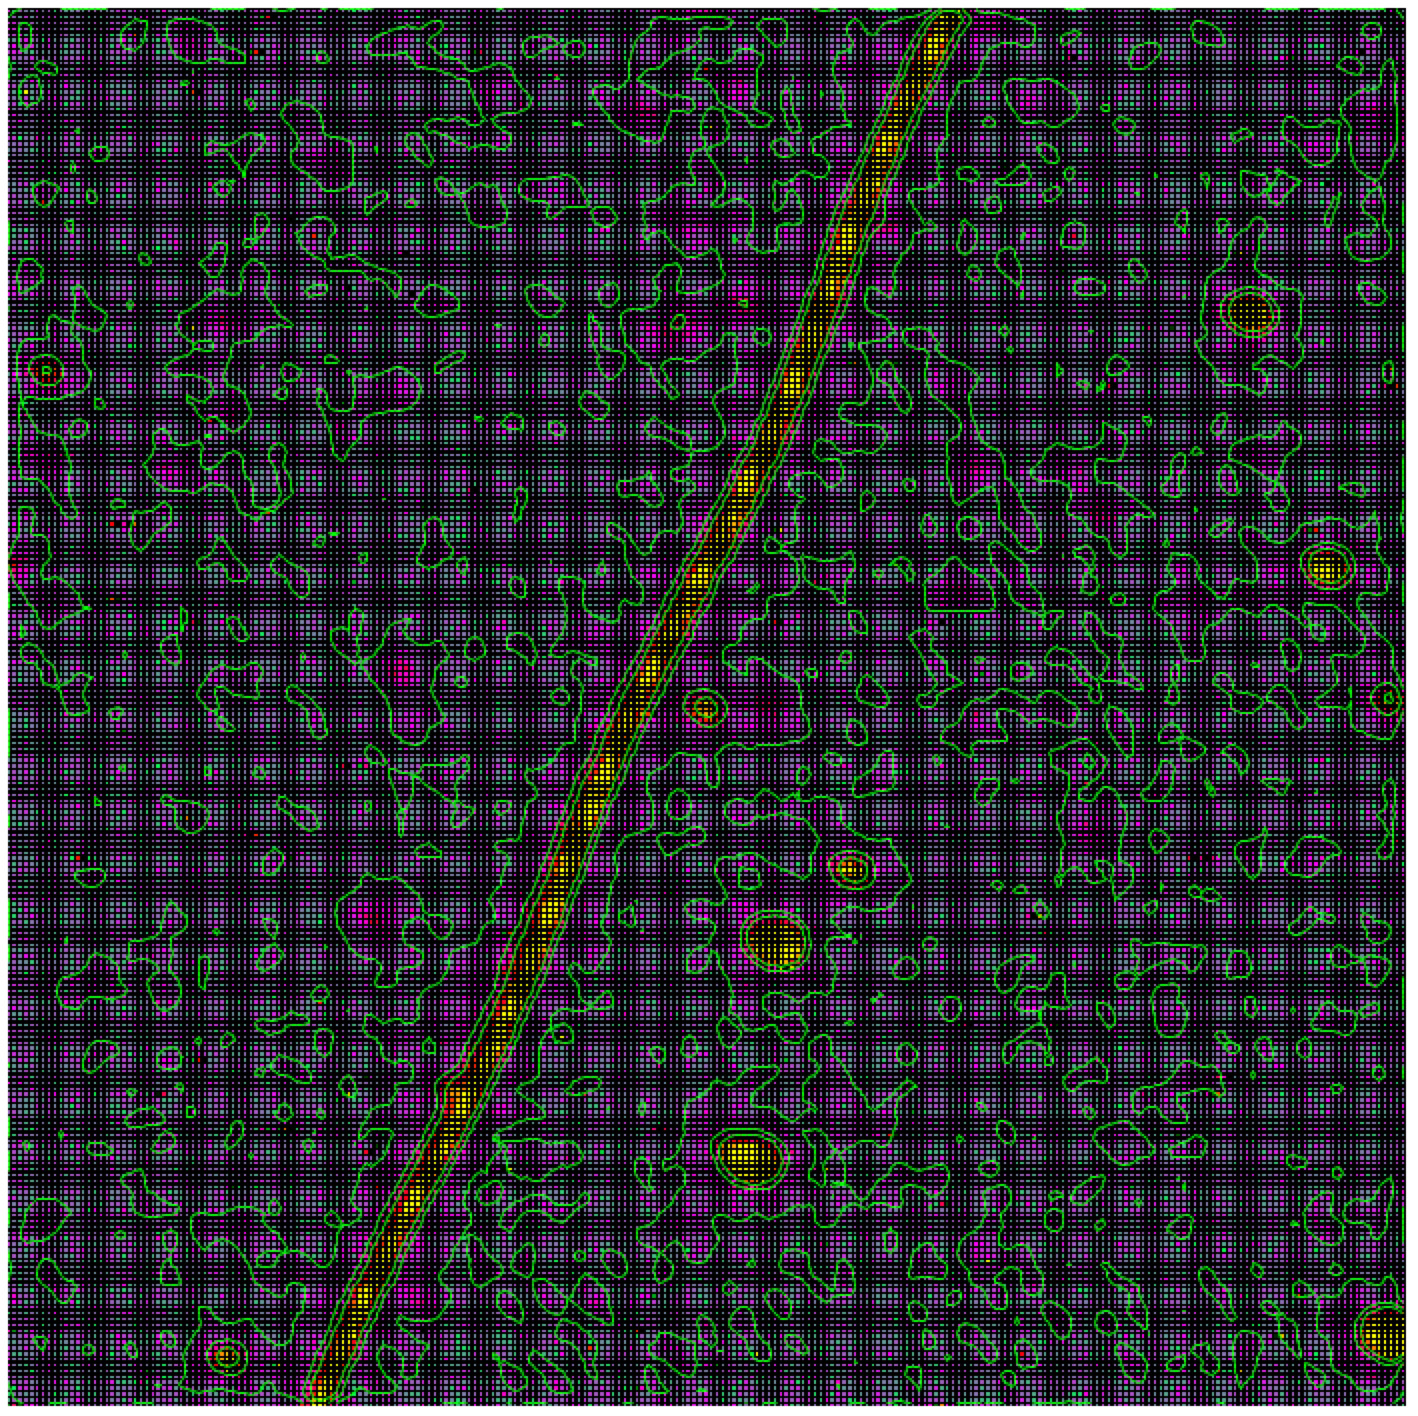
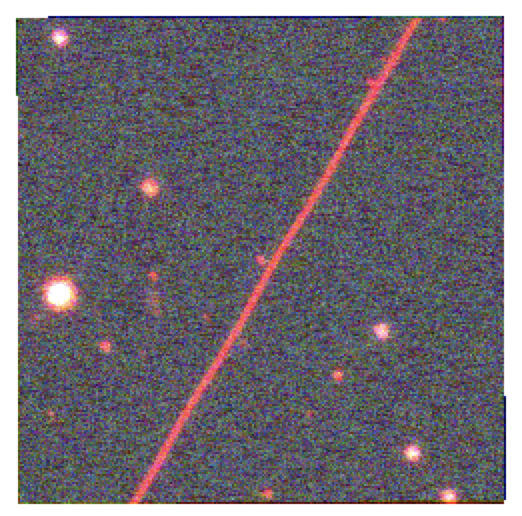
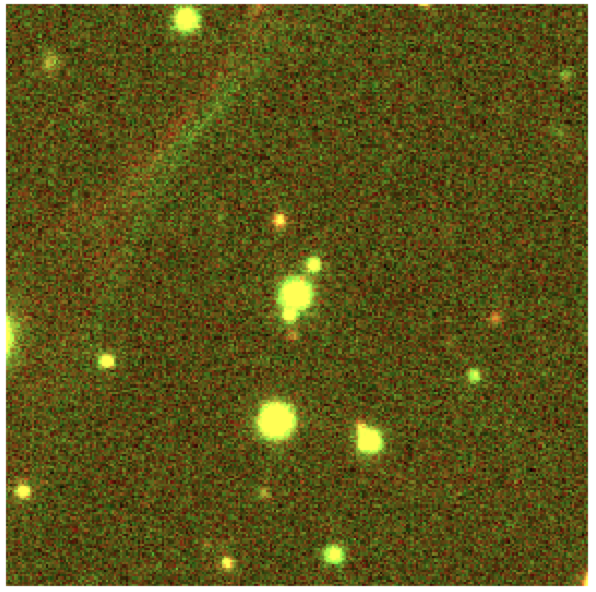
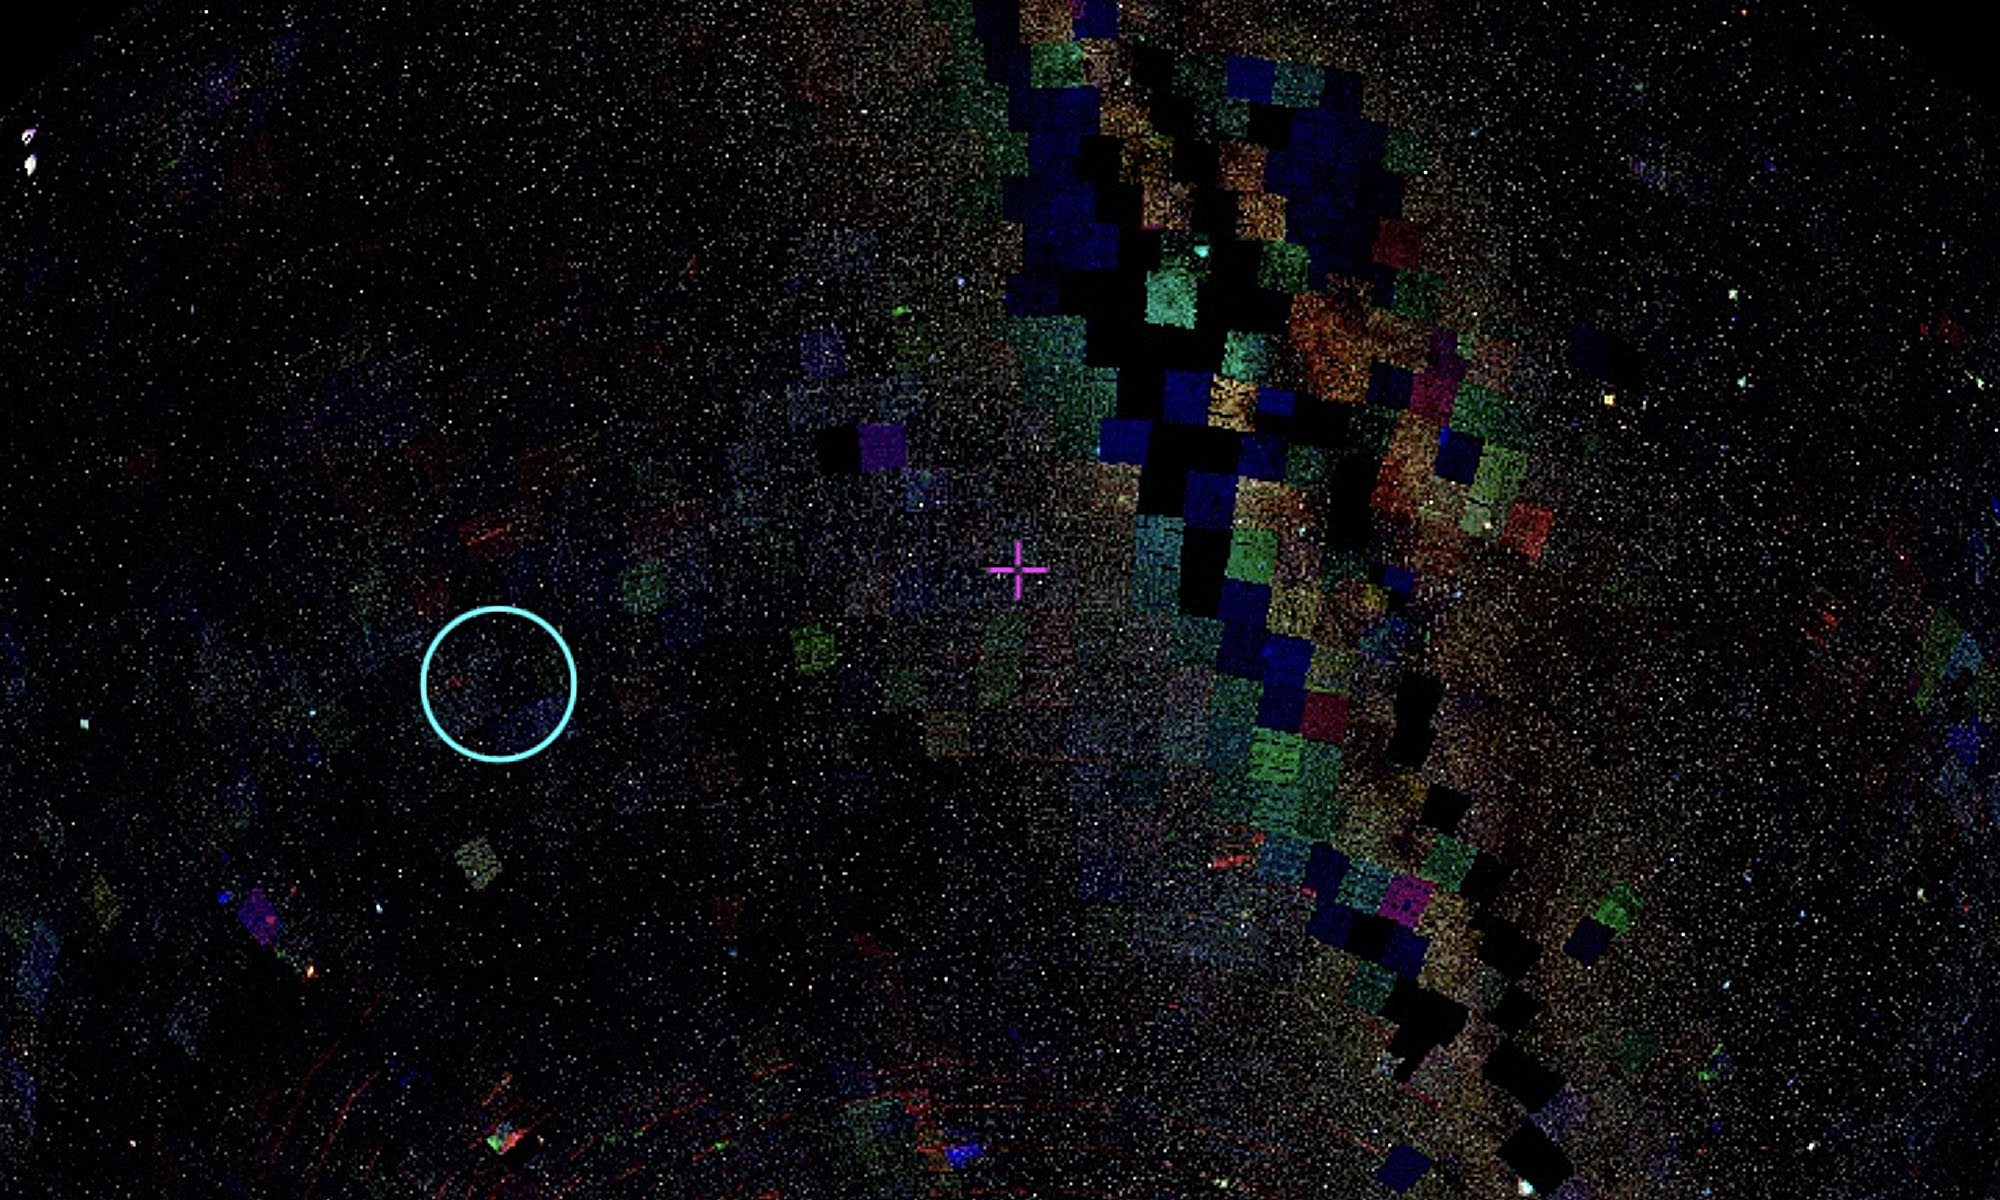
Finally with this same sky object, I tested what showing the contours of the sky objects looks like, as well as using the ‘block in’ and ‘block out’ functions which reduces smoothness in the image.  There are some interesting details in these results that I hope I can recreate!

3D layers

Still messing around with these FITS images!

I have been thinking about the challenge of mapping the impact of satellites and the dynamic elements of space that are captured differently from every angle.

This time I have returned to more familiar domains of regular old RGB channels. Here, I separated the RGB channels into three separate layers then pulled them apart in 3D space.

Interesting things happen when this is translated into a projection for 360 video or VR.


Aligning images: difference and sequence

Difference

The last FITS images I made using the I, R, and G filter bands as R, G, B channels. While sorting through SkyMapper images to do this, I felt there were more satellite streaks in Z bands than any other. While I would need to look at a bigger sample to see if this is actually true, it seemed important to make images with the other bands that weren’t included in the RGB images I was creating.

As an experiment I made new frames using the Z, V and U filter bands as RGB channels. This gives two images of the same ObjectID where the stars are aligned but satellite streaks, interference, and intensity of data are different. 

To compare, I’ve made images that blink between the two frames:

Sequence

A while ago I considered whether satellite lines could be used to make a drawing. Although a playful idea, it emerged again in these short loops, especially when the lines link up across frames, as in the above grid.

Without a clear idea why, I wanted to try lining up the frames in an animation so the angle of the satellite line circulated around a centre point. I chose 24 frames where the line dissected the frame, and put them into a sequence where the line moved from connecting the left hand top corner to the right hand top corner. 

Then, I duplicated this sequence, reversed the order of frames, then rotated it 90 degrees and mirrored it (brain gymnastics), so that the line then travelled from corner to corner on the left hand side of the frame.

Repeating this two more times meant that the line travelled around the four sides of the frame. Most frames appear at four different angles throughout this sequence:


I say ‘most’, because an interesting part of this process what that mirroring and rotating the image created a difference that altered how the images moved in sequence. To counter this I found that it was necessary to reorder some of the frames by hand, and take some out, to create smoother motion from the new orientation of lines.

While I can’t pinpoint why this might be useful in any way (!!) it stood out to me that the process relied on reflection, and that this reflection caused unexpected angles and subsequent alterations, which I can’t help comparing to the impacts of a satellite reflecting light.

More FITS

Some more FITS images made as RGB frames using the I, R, and G bands of satellite contaminated Skymapper images.

I am interested in the streak as a line drawn by sunlight, and in tracing this line back to the satellite that made it.

Planning to animate some of these next.